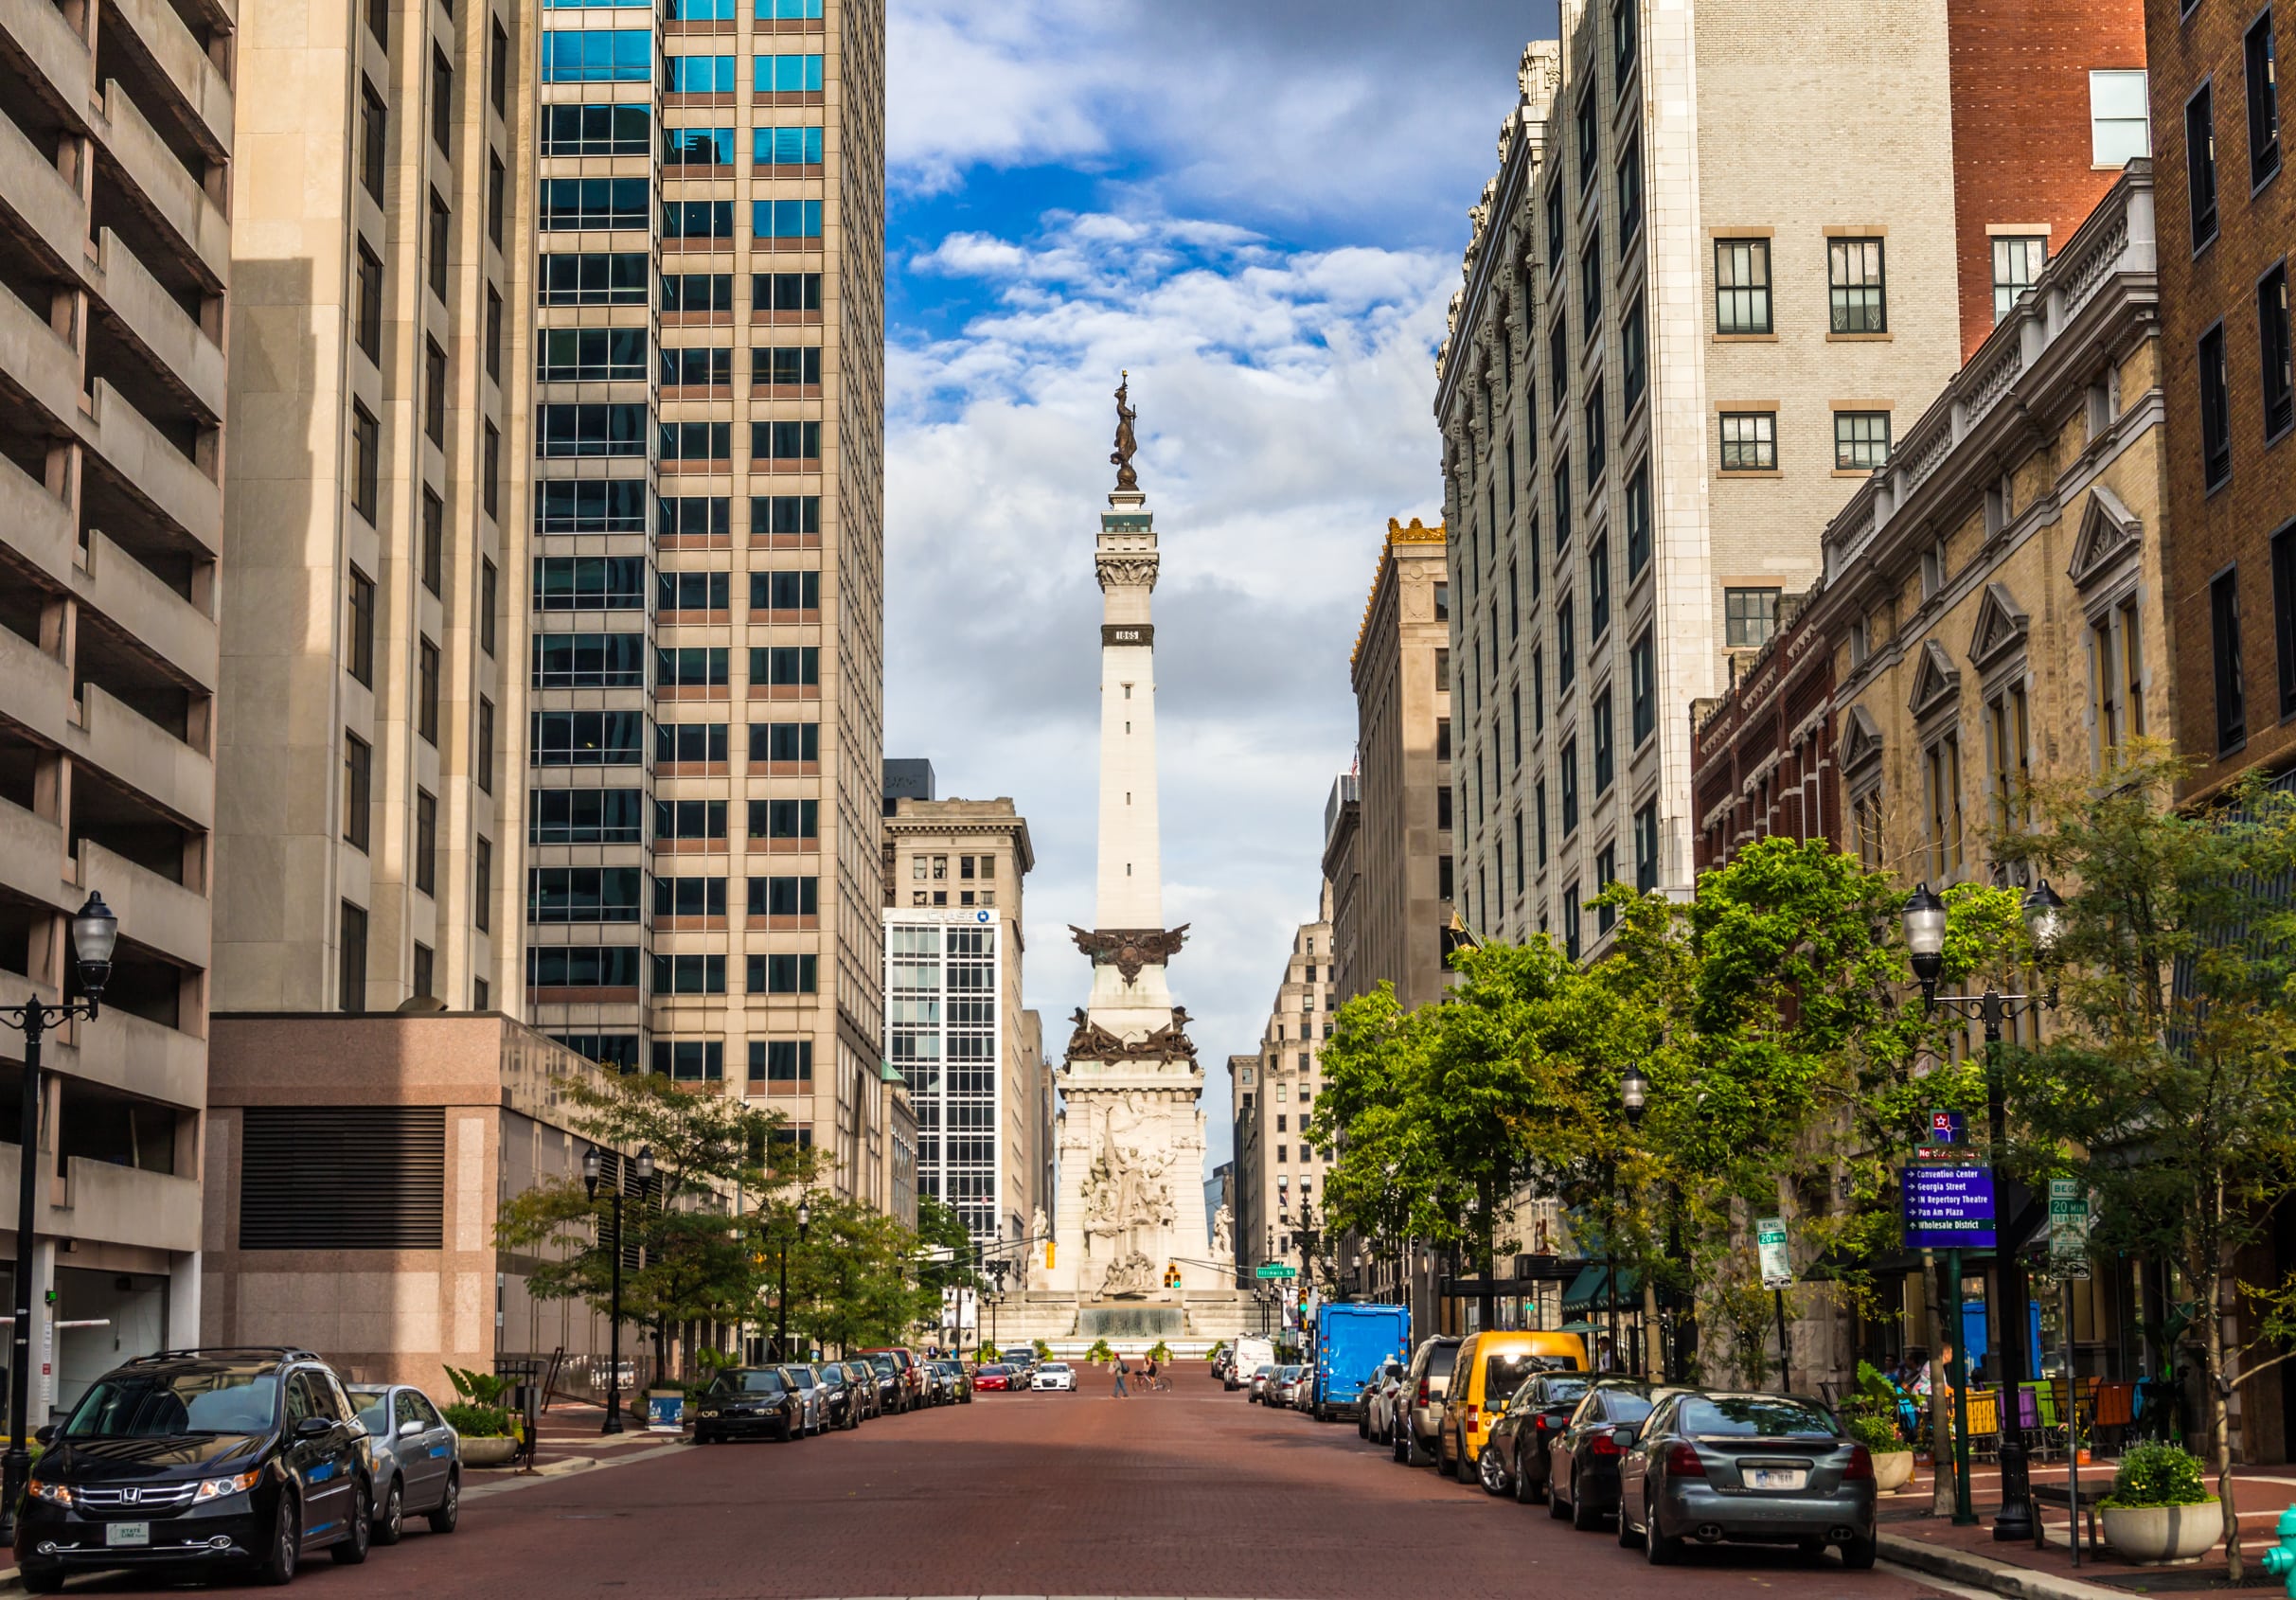
The city of Indianapolis is a key industrial, commercial and transportation center in the U. S. Midwest. It is commonly referred to as the ‘Crossroads of America,’ thanks to its easy accessibility from a wide variety of locations. Visitors to the state of Indiana become aware that they are in the presence of ‘Hoosiers.’ The appellation was adopted by the state more than 150 years ago and its derivation is cloudy and subject to great debate.
The Indianapolis of today was born from manufacturing and transportation, but the city has worked hard to shed its image as a Rust Belt city – and has succeeded. This was accomplished by an aggressive downtown redevelopment effort that began in the 1980s, built on a diversification of the city’s economic base that started in the 1960s. Downtown Indianapolis is a mix of gleaming skyscrapers and modern condominiums, historic homes and districts, sophisticated restaurants, outdoor cafés, sports venues, theaters, art galleries and boutique shops.
The area was hard hit by the 2008 recession, but it has since experienced a renaissance. Overall, employment grew by 2.8% last year. Indianapolis was recently named one of the best metro areas for jobs, according to Indeed.
Key Industries
Prior to the 1980s, manufacturing plants employed a good portion of the local workforce. Manufacturing is still important, but the city’s focus has expanded to include thriving health care, biotechnology, information technology, tourism and transportation sectors.
The region is home to 50 business headquarters and four Fortune 500 companies:
- Anthem (formerly WellPoint): health benefits and insurance
- Eli Lilly: pharmaceutical development and manufacturing
- Cummins: construction and farm machinery (in nearby Columbus, Indiana)
- Simon Property Group: real estate financials
The diversity of the local economy is illustrated in the list of top employment occupational groups in Marion County, where Indianapolis is located.
The Top Ten Occupational Groups by Employment:
- Office and administrative support – 87,010 workers
- Transportation and material moving – 53,100 workers
- Sales and related – 51,120 workers
- Food preparation and serving related – 48,210 workers
- Health care practitioners and technical – 46,050 workers
- Production – 35,855 workers
- Management – 29,360 workers
- Education, training and library – 29,184 workers
- Business and financial operations – 27,520 workers
- Installation, maintenance and repair – 20,555 workers
Areas of Job Promise
Employment in the area is expected to be strong this year. The metro area added nearly 23,000 jobs last year, an increase of 2.1%. This year, analysts predict that jobs will grow by another 2.5%.
The current unemployment rate is a very low 2.6%, lower than the state of Indiana’s rate of 3.2% and the national rate of 3.6%.
Occupations Expected to See Above-Average Growth through 2026
|
Occupation |
Average annual wage (in USD) |
Total openings |
|
General and operations managers |
98,100 |
46,598 |
|
Registered nurses |
62,450 |
46,107 |
|
Accountants and auditors |
66,600 |
22,345 |
|
Electricians |
58,850 |
19,058 |
|
Medical assistants |
31,410 |
18,807 |
|
Medical secretaries |
34,250 |
16,152 |
Source: Indiana Department of Workforce Development
The job market is expected to be brisk in the near term, according to the latest Manpower Employment Outlook Survey. Among area employers asked about their hiring plans for the coming quarter:
- 33% plan to increase staff levels
- 64% plan to maintain current staff levels
- 2% plan to decrease staff levels
- 1% are unsure of their plans
Over the coming quarter, job prospects are strongest in construction, durable goods manufacturing, transportation and utilities, wholesale and retail trade, financial activities, professional and business services, education and health services, leisure and hospitality, and other services. Employers in non-durable goods manufacturing plan to decrease staff, while hiring in information and government is expected to remain the same.
Salaries
Indianapolis’ average wage is at its highest level since the recession and continues to rise. Wages increased an average of 4.1% last year. Industries with the highest wage growth between 2008 and 2017 include:
- Finance and insurance: 12.7%
- Manufacturing: 10.6%
- Wholesale trade: 8.1%
- Real estate: 4.1%
- Information: 3.7%
Average Hourly Wages for Selected Occupations in the Area
|
Occupation |
Average Hourly Wage Indianapolis (in USD) |
Average Hourly Wage National (in USD) |
|
All occupations |
23.74 |
24.98 |
|
Bookkeeping, accounting and auditing clerks |
20.02 |
20.25 |
|
Insurance sales agents |
33.50 |
32.64 |
|
Laborers and freight, stock and material movers |
14.45 |
14.85 |
|
Machinists |
21.58 |
21.75 |
Source: US Bureau of Labor Statistics
|
Administrators |
85,560 to 95,370 |
97,030 to 111,210 |
|
School teachers |
55,480 to 57,000 |
59,980 to 64,340 |
|
Post-secondary, computer science |
88,980 |
96,200 |
Source: US Bureau of Labor Statistics
Income Snapshot
Incomes in the city tend to be low. The per capita income is 27,860 USD annually. That’s about 6,000 USD lower than the national per capita of 33,831 USD. About 16.5% of city residents live below the poverty level, compared to 13.1% of all Americans.
Incomes increase dramatically in some suburbs. The per capita income in the metropolitan area is 32,723 USD annually, slightly less than the national average. Only 12.1% of residents live below the poverty level. In certain suburbs, incomes are markedly higher. In Carmel, Indiana, for example, the per capita income is 63,773 USD annually, and just 2.2% of residents live below the poverty level.
The state’s minimum wage is 7.25 USD, the same as the federal minimum wage. However, most people earn much more than that. The mean hourly wage is 23.74 USD in the Indianapolis-Carmel metro area, compared with the national mean of 24.98 USD per hour.
Follow @goinglobal Tweet to @goinglobal


